32″ vs 29″ wheels: what the tests actually say

There are only a handful of real tests of 32″ against 29″ wheels, and they do not agree. This page lists every source the simulator is built on, what each one found, and how the model compares.

What the tests say, in short

  • Independent field tests found the 32″ wheel saving roughly 5.5 to 9.5 W of rolling resistance at about 30 km/h, more on gravel than on pavement.
  • The maker of a 32″ gravel bike reports 11.7 W at 35 km/h, and an aero penalty of 1.2 to 3.1 W.
  • The sceptical view is that wheel diameter does not change tyre losses at all, and that the field tests cannot resolve differences this small.
  • Theory sits in between: a longer contact patch should help a little on hard ground and more on soft ground.

Published tests next to the model

Each published test is re-run inside the simulator with the same speed, system weight, tyre width and pressures. The table shows the rolling-resistance watts saved by the 32″ wheel: what was published, and what each calibration of the model predicts.

TestPublishedScepticPhysicsBest estimateField testsMaker data
Karrasch: pavement5.5 W-0.8 W2.1 W3.7 W5.3 W7.7 W
Karrasch: Cat 1 gravel9.0 W-1.1 W3.4 W5.8 W8.4 W12.2 W
Karrasch: Cat 2 gravel9.5 W-0.5 W4.2 W6.7 W9.3 W13.3 W
Karrasch: cobbles6.0 W-0.9 W2.8 W4.8 W6.9 W9.9 W
Delaney + Karrasch: hardpack7.4 W-0.9 W3.4 W5.8 W8.4 W12.6 W
Avona: bumpy Cat 1 gravel11.7 W-0.4 W3.3 W5.4 W7.6 W11.2 W

Watts of rolling resistance saved by the 32″ wheel. Negative values mean the 32″ wheel loses. The "Best estimate" calibration sits about halfway between contact-patch theory and the field tests on purpose. The bump model is also checked against a laboratory experiment that measured vibration losses directly (Vazquez Fernandez, Dell'Orto and Moore, 2026: a 700×28 tyre over 20 mm planks).
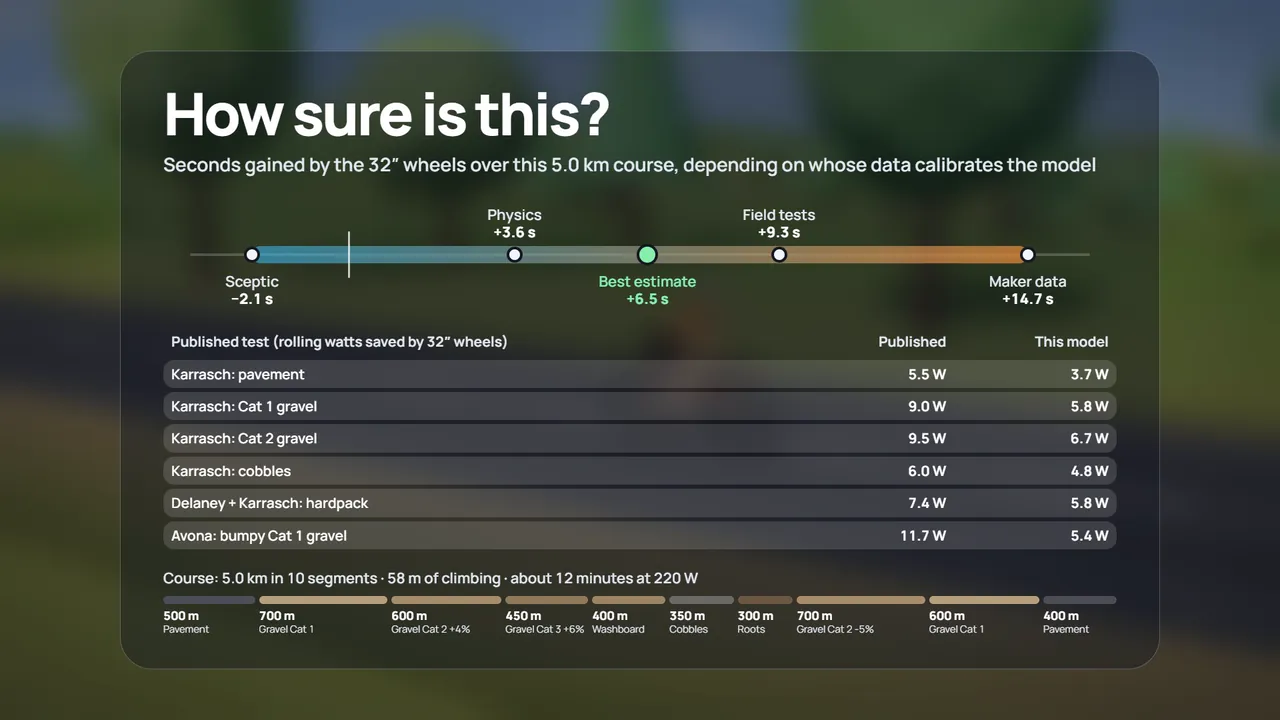
How sure is this? Board from the film showing the 32-inch result for each calibration and the published tests next to the model

Independent field tests

Outdoor tests by people who do not sell 32″ bikes. They are the main reason to think the bigger wheel rolls faster, and they are also small: a handful of runs each, none peer reviewed.

Independent

John Karrasch / Escape Collective: first efficiency tests of 29 vs 32 tyres (virtual elevation)

John Karrasch ran the first independent efficiency tests of 29″ against 32″ tyres for Escape Collective, using the virtual elevation method on Maxxis Aspen 2.4″ tyres, with the 32″ tyre at 1 psi less. The detailed results are behind Escape Collective's paywall; the watt figures used here are the ones reported by CyclingAbout.

escapecollective.com ↗
Independent

CyclingAbout: 32-inch wheels against the clock

A public summary of the Karrasch results by surface: about 5.5 W saved on pavement, 9 W on Cat 1 gravel, 9.5 W on Cat 2 gravel and 6 W on cobbles, at roughly 30 km/h.

cyclingabout.com ↗
Independent

The Ride with Ben Delaney + John Karrasch: matched Stinner gravel bikes

Ben Delaney and John Karrasch tested two matched Stinner gravel bikes on 50 mm tyres on hardpack at 35 km/h. Rolling resistance came out at Crr 0.0097 for 700c and 0.0089 for 32″, a saving of 7.4 W. The channel is sponsored.

youtube.com ↗

Maker data

Numbers published by a brand that sells a 32″ gravel bike. They show the biggest gains, and they also include the only wind tunnel data on the aero penalty.

Maker

Avona Callis 32 white paper

Avona's white paper for the Callis 32 reports an 11.7 W rolling gain at 35 km/h and an aero penalty of 1.2 to 3.1 W from the GST wind tunnel. It is a commercial source, with two runs per bike that were not alternated.

callis32.avona.cc ↗
Maker

CyclingAbout: how much slower are 32" gravel bikes in the wind tunnel

CyclingAbout's summary of the Avona wind tunnel data: the 32″ wheels have about 9% more frontal area, which costs 1.2 to 3.1 W at 35 km/h.

cyclingabout.com ↗
Maker

Avona Callis 700c vs Callis 32 geometry (Bike Insights, Escape Collective)

The geometry of the Avona Callis in both wheel sizes shows what a 32″ wheel does to a frame: chainstays grow from 420 to 440 mm, wheelbase from 1012 to 1050 mm, bottom bracket drop from 75 to 112 mm and trail from 68 to 81 mm.

escapecollective.com ↗

The sceptical view

Not everyone accepts that diameter changes rolling resistance at all. This side of the argument sets the lower end of the simulator's range.

Critic

Jan Heine / Rene Herse: why 32-inch wheels are not faster

Jan Heine of Rene Herse argues that 32″ wheels are not faster. His own tests of 26″, 650b and 700c wheels found no difference inside the error bars, and he points out that virtual elevation testing has 2 to 3% run-to-run variation, which is as large as the claimed gains.

renehersecycles.com ↗
Critic

Rene Herse: suspension losses

Rene Herse's rumble-strip tests on suspension losses: the vibration absorbed by the rider's body can cost far more power than the tyre's own flex. This is why the simulator models the rider as a sprung, damped mass.

renehersecycles.com ↗

Mountain bike tests of 32″ wheels

Mountain bike magazines measured 32″ wheels before gravel did. Their weights, diameters and inertia figures anchor the bike model.

Independent

Bike-Test: the big 32-inch MTB test

Bike-Test's 32″ mountain bike test measured wheel inertia of 0.12 against 0.16 kg·m² (+33%) and a bike about 700 g heavier, and timed an obstacle course 4% faster on the bigger wheels.

bike-test.com ↗
Independent

BIKE Magazin: 32-inch wheels in practical and laboratory tests

BIKE Magazin measured real diameters (817 against 743 mm with 2.4″ tyres), wheelset weights and 27% more inertia for 32″ wheels in practical and laboratory tests.

bike-magazin.de ↗
Independent

Steyn & Warnich 2014: comparison of 26 and 29 inch MTB rolling resistance (coast-down)

A 2014 coast-down study of 26″ against 29″ mountain bike wheels by Steyn and Warnich: no difference on bitumen, 12 to 15% less rolling resistance for the bigger wheel on grass and gravel, and about 20% on sand. It is the best published evidence that wheel size matters more as the ground gets softer.

repository.up.ac.za ↗

Reference data for tyres and aerodynamics

Measurements that are not about 32″ wheels, but set the baseline the comparison starts from.

Lab data

Bicycle Rolling Resistance: Schwalbe G-One RX Pro 50

Bicycle Rolling Resistance measured the Schwalbe G-One RX Pro 50 at Crr 0.00582 on a steel drum at 28 psi. The simulator converts drum values to a flat road with the curvature correction from Bicycling Science.

bicyclerollingresistance.com ↗
Lab data

Silca: rolling resistance and impedance (Part 4B)

Silca's work on impedance: casing losses fall as pressure rises, but vibration losses rise, so every surface has a break-point pressure. This is what the simulator's pressure sweep shows.

silca.cc ↗
Lab data

Cyclingnews: gravel bikes wind tunnel tested

Cyclingnews wind tunnel tests of gravel bikes: rider plus bike CdA of 0.373 to 0.393 m² at 35 km/h on 45 mm tyres, the baseline for the simulator's 0.38 m² on the hoods.

cyclingnews.com ↗

Test the claims yourself

Pick a calibration in the "Model & sources" tab and race the two bikes on any surface.