How the simulator works
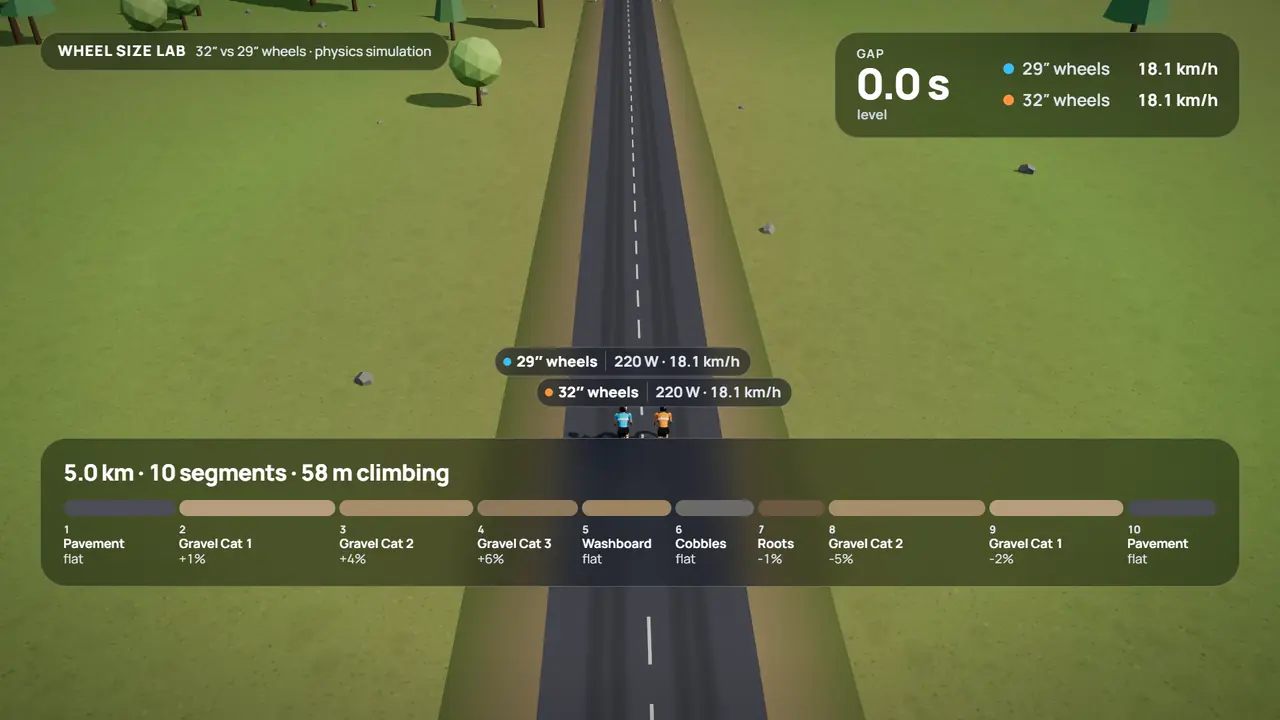
Wheel Size Lab is a physics simulation, not a recording. Two virtual bikes that differ only in wheel size ride the same course, and the computer works out, many times a second, where every watt goes.
The test
By default both bikes carry the same rider: 75 kg, 178 cm tall, producing a constant 220 W on the hoods. Both use the same 50 mm fast gravel tyre. Tyre pressure is matched, meaning each tyre is pumped to squash by the same amount under load, which works out at 25.0 psi for the 700c wheel and 23.9 psi for the 32″ wheel.
The course is 5 km long with 58 m of climbing, split into ten segments from smooth pavement to rooty singletrack. All of this can be changed in the simulator.
Where the watts go
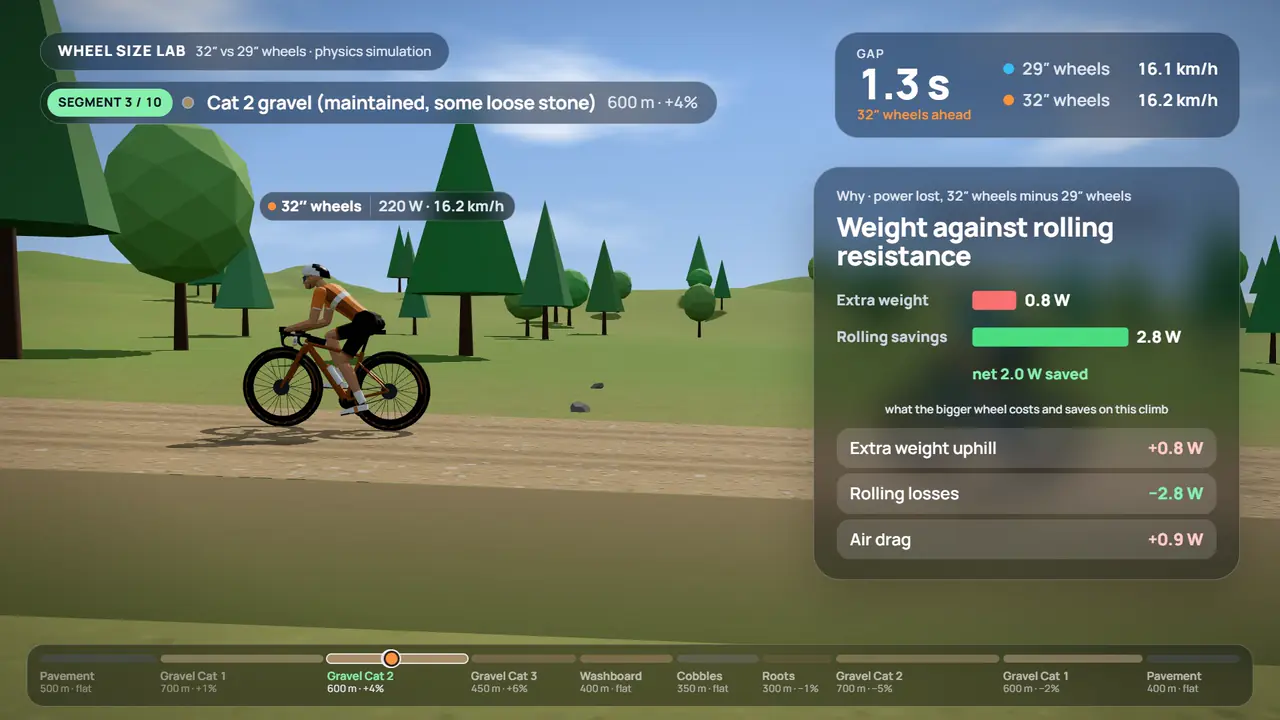
At every step the rider's power, after drivetrain losses, has to pay for:
- Air drag. The drag area of rider and bike, the extra frontal area of bigger wheels, a higher handlebar if you add one, and wind from any direction including the yaw angle it creates. Air density follows temperature and altitude.
- Tyre flex. The energy lost bending the tyre casing, which depends on the tyre, its width, its pressure, the load on it and the wheel diameter.
- Loose surface. The energy lost pushing gravel aside and sinking into it. A longer contact patch spreads the load and sinks in less.
- Bumps and vibration. Both bikes roll over the same generated surface, sampled every 5 mm. The tyre is simulated as an air spring pressed onto that profile, and the rider as a mass on a spring and damper. Energy absorbed by the tyre and by the rider's body is lost.
- Gravity. Climbing costs more for the heavier bike and descending pays a little back.
- Acceleration. Speeding up the bike and rider, and spinning up the wheels. Bigger, heavier wheels have 34% more rotational inertia.
The two bikes
The 32″ bike is not just the 700c bike with bigger hoops. The simulator scales rim, tyre, spoke and frame weights with size, and uses geometry from a real 32″ gravel bike: a longer wheelbase, more bottom bracket drop and more trail. With default settings that gives:
| 29″ (700c) | 32″ | Change | |
|---|---|---|---|
| Rim bead seat diameter | 622 mm | 686 mm | +64 mm |
| Outer diameter with a 50 mm tyre | 722 mm | 786 mm | +9% |
| Complete bike weight | 8.75 kg | 9.18 kg | +428 g |
| Wheel inertia (one wheel) | 0.122 kg·m² | 0.163 kg·m² | +34% |
| Drag area CdA, rider on the hoods | 0.380 m² | 0.384 m² | +1.0% |
| Contact patch length | 134 mm | 140 mm | +4% |
| Angle of attack on a 15 mm bump | 16.6° | 15.9° | 4.2% flatter |
| Suggested pressure, same tyre drop | 25.0 psi | 23.9 psi | −1.1 psi |
Five calibrations, because the experts disagree
How strongly rolling losses depend on wheel diameter is the contested part. Contact-patch theory predicts a modest effect. Independent field tests found about twice that. The maker's data shows more again, and one well-known critic argues the effect is zero. The simulator does not pick a winner; it lets you switch between five calibrations and shows the whole range.
Sceptic
−2.1 sWheel diameter makes no difference to tyre flex or to loose-surface losses, and the aero penalty is at the high end of the wind tunnel data. Only the geometry of rolling over bumps is left.
Tyre flex exponent 0 · loose surface exponent 0
Physics
+3.6 sContact-patch theory and soft-ground sinkage theory only, with no fitting to any test of 32″ wheels.
Tyre flex exponent 0.75 · loose surface exponent 0.67
Best estimate
+6.5 sHalfway between theory and the independent field tests. For the Delaney and Karrasch gravel test it predicts 5.8 W where 7.4 W was measured.
Tyre flex exponent 1.2 · loose surface exponent 1
Field tests
+9.3 sFitted so that pavement and gravel savings match the Karrasch field tests. These imply a diameter effect about twice what theory predicts.
Tyre flex exponent 1.7 · loose surface exponent 1.4
Maker data
+14.7 sFitted to the 11.7 W rolling gain and the best wind tunnel result in the white paper from the maker. A commercial source with two runs per bike.
Tyre flex exponent 2.5 · loose surface exponent 2.2
The seconds are the 32″ bike's result over the default 5 km course. The exponents say how fast losses fall as the wheel gets bigger: with exponent n, losses scale with diameter to the power −n, so zero means diameter makes no difference.
What it does not model
- Handling, fit and toe overlap, which matter a great deal for shorter riders on very big wheels.
- Cornering grip differences. No measurements exist, so the effect is an estimate and small.
- Aerodynamics of a real 32″ frame. The penalty comes from wheel frontal area and one maker's wind tunnel runs.
- Tyre and rim availability, punctures, mud and everything else that decides real races.